
Restaurant financial projections for UK banks. Cash flow forecasting, break-even analysis, projection mistakes that kill funding.
Why do bank managers reject restaurant plans? Not the food concept: the numbers. Your restaurant financial projections are where funding applications succeed or fail. Banks reject plans where the numbers look like wishful thinking rather than realistic forecasts based on actual research and logic.
Short on time? Here's the quick version
- Three core statements: Profit & Loss projection, cash flow statement, break-even analysis
- Revenue formula: Covers × Average Spend × Days Open × Occupancy Rate
- Starting occupancy: 40-50% month one, growing to 65-70% by year one
- 30/30/30/10 rule: 30% food, 30% labour, 30% overheads, 10% profit as your benchmark
- Working capital: Budget 3-6 months of operating costs minimum
Full guide with formulas and examples below
Related: For the complete business plan framework, see our restaurant business plan guide.
If you're staring at a blank spreadsheet wondering how to project revenue for a restaurant that does not exist yet, you're not alone. This guide breaks down exactly what UK lenders expect to see in your restaurant financial projections.
Based on analysis of successful UK restaurant funding applications and input from bank lending officers.
What You'll Learn
- What restaurant financial projections actually include
- How to create realistic revenue forecasts banks trust
- The key financial statements lenders expect
- Common projection mistakes that kill funding
- How to sanity-check your numbers with the 30/30/30/10 rule
What Are Restaurant Financial Projections?
First, let's define the term. Restaurant financial projections are forward-looking estimates of your revenue, costs, and profitability over a specific period, typically 12 to 36 months. They show lenders how you expect your restaurant to perform financially.
Your projections should include:
- Revenue forecast: Monthly expected sales
- Cost of goods sold (COGS): Food and drink costs
- Operating expenses: Labour, rent, utilities, marketing
- Cash flow statement: Money in versus money out each month
- Break-even analysis: When revenue covers costs
For example, a 40-cover bistro might project £30,000 monthly revenue at 60% occupancy, with 30% food costs (£9,000) and 30% labour (£9,000), reaching break-even at month 14. When you build the marketing line into your overheads, work out the likely return on that spend so the figure is grounded rather than guessed.
Why this matters
According to UK Finance data, vague or unrealistic projections remain a top reason banks reject restaurant funding applications. Specific, documented assumptions build trust.
How Do You Create Realistic Revenue Forecasts?
Now that you understand what projections include, let's tackle revenue forecasting. This is where most restaurant owners struggle. You cannot know exactly how much you will make, but you can build a rational estimate.
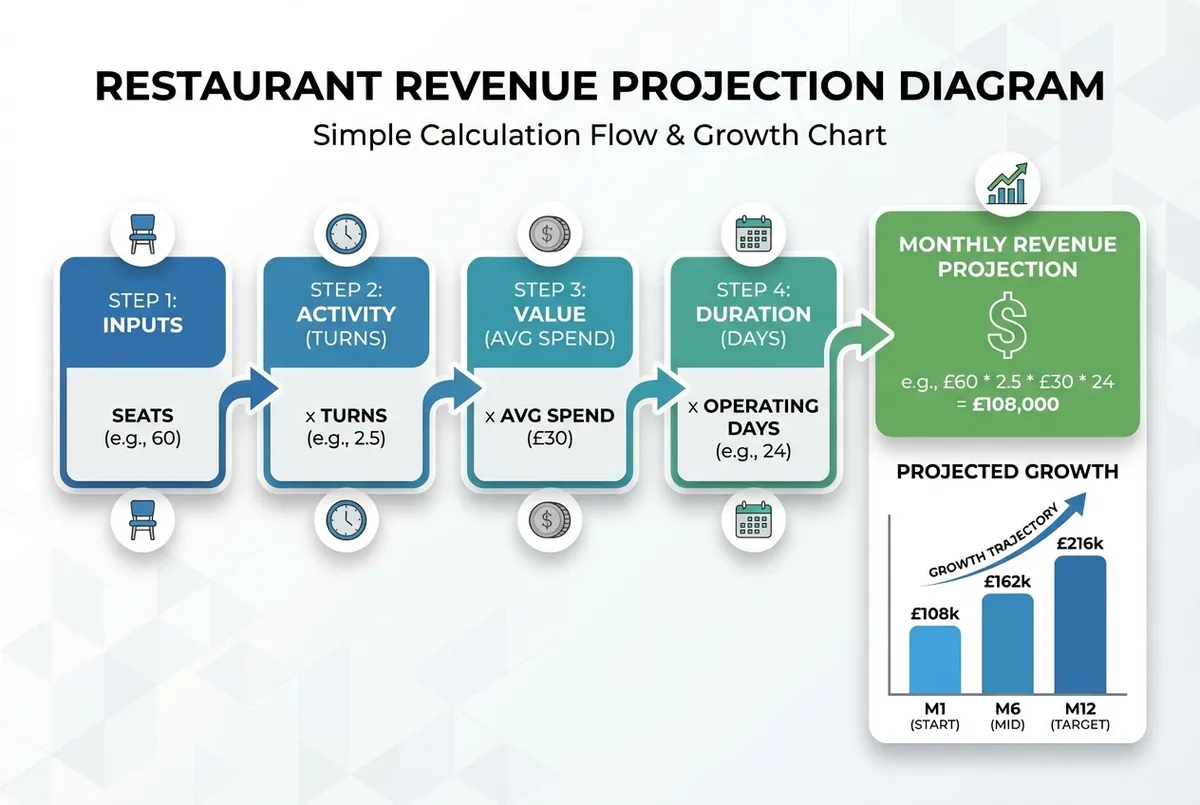
The revenue calculation formula:
Monthly Revenue = Covers × Average Spend × Days Open × Occupancy Rate
For a 40-cover restaurant with £25 average spend, open 26 days, at 50% occupancy:
- Month 1: 40 × £25 × 26 × 0.50 = £13,000
- Month 6: 40 × £25 × 26 × 0.65 = £16,900
- Month 12: 40 × £25 × 26 × 0.70 = £18,200
Key assumptions to document:
| Assumption | Approach |
|---|---|
| Occupancy ramp-up | Start at 40-50%, grow to 65-70% by year one |
| Average spend | Base on competitor research, not hopes |
| Seasonality | Account for January/August drops |
| Days open | Realistic for your concept |
For example, a cafe owner might research three nearby competitors, note their average lunch spend is £12-15, and use £13 as her conservative assumption. She documents this in her projections appendix, showing the bank she did actual research rather than guessing.
Warning
If you're only projecting optimistic scenarios without showing conservative alternatives, you'll lose to applicants who demonstrate they've considered what happens when things go wrong.
What Financial Statements Do Lenders Expect?
Moving on to the documents themselves. UK banks typically expect three core financial statements in your restaurant financial projections.
1. Profit and Loss (P&L) Projection
Shows monthly revenue minus costs to calculate profit or loss. Your P&L should include line items for revenue, food costs, labour costs, overheads, and net profit. Show month-by-month figures for at least 12 months, with quarterly summaries for years two and three if seeking longer-term funding.
For example, a small bistro might show month one revenue of £13,000 growing to £18,000 by month 12, with costs scaling proportionally using the 30/30/30/10 benchmarks. The key is consistency: if revenue grows, costs should grow logically too.
2. Cash Flow Statement
Shows actual cash in and out each month. Critical because profitable restaurants can still run out of cash. Include:
- Opening cash balance
- Cash received from sales
- Cash paid for supplies, wages, rent
- Closing cash balance
3. Break-Even Analysis
Calculates when monthly revenue equals monthly costs. Your break-even point tells lenders when you stop burning through working capital and start sustaining yourself.
The gov.uk business finance guidance recommends clearly showing how long until break-even and how much cash you need to survive until then. If your break-even is month 18 but you only have working capital for 12 months, lenders will flag the gap.
Info
If you can't explain your break-even point without looking at notes, that's usually a sign you need to understand your own numbers better. Banks don't expect perfect accuracy; they expect reasonable assumptions and clear logic.
What Are Common Projection Mistakes?
At this point, let's address what goes wrong. These mistakes kill funding applications more than weak concepts.
Mistake 1: Over-optimistic revenue
Projecting 80% occupancy in month one signals inexperience. Start at 40-50% and build gradually. Lenders have seen thousands of restaurant plans. They spot fantasy numbers immediately.
Mistake 2: Flat labour costs across growth
If revenue doubles, staffing must increase. A projection showing 30% more revenue with the same wage bill tells lenders you have not thought through operations.
Mistake 3: Ignoring seasonality
UK restaurants typically see 20-30% drops in January and August. Projections showing steady growth month-over-month lack credibility.
Mistake 4: Missing working capital
You need cash to survive until break-even. Budget three to six months of operating costs as working capital, not just fit-out money.
Info
Ask yourself: Would I invest based on these projections? If your numbers only work in a perfect scenario, they are not projections; they are hopes.
Warning
If you're only copying numbers from other business plans without understanding your specific situation, you'll lose to applicants who built projections from their own market research. Every restaurant is different: your rent, your location, your concept all affect the numbers.
How Does the 30/30/30/10 Rule Work?
Furthermore, you should know this benchmark. The 30/30/30/10 rule is a sanity check for restaurant cost allocation that lenders expect you to understand.
The breakdown:
- Food costs: 30% of revenue
- Labour costs: 30% of revenue
- Overheads: 30% of revenue
- Profit: 10% of revenue
If your projections show significantly different ratios without explanation, expect questions. For example, a fast-food concept might run 25% food costs but higher rent. A fine-dining restaurant might show 35% food costs with premium pricing.
Pro tip
A cafe owner projecting 20% food costs should explain how: perhaps through high-margin drinks and pastries offsetting food items. Document the rationale for any deviation from standard benchmarks.
Minimum Viable Action Plan
That is a lot to take in. If you only have 30 minutes a week to work on your restaurant financial projections, start here:
This week, build your projection foundation
- Day 1-2: Research competitor average spend and occupancy in your area
- Day 3-4: Create a simple revenue calculation using the formula above
- Day 5-7: Draft a basic 12-month P&L using the 30/30/30/10 rule as your starting ratios
You can refine later. A rough projection you can explain beats a complex spreadsheet you do not understand.
Key Takeaways
If you run a restaurant and want to see how Local Brand Hub can support your marketing, explore our restaurant marketing tools.
Key Takeaways
Here is what matters most for restaurant financial projections that UK lenders trust:
- Include all three statements: P&L, cash flow, break-even analysis
- Start conservative: 40-50% occupancy month one, growing gradually
- Account for seasonality: January and August drops are real
- Apply the 30/30/30/10 rule: Use it as a sanity check for cost ratios
- Budget working capital: Three to six months of operating costs minimum
- Document assumptions: Every number needs a source or rationale
Info
Restaurant financial projections are not about predicting the future perfectly. They are about showing lenders you understand the financial realities of running a restaurant.
Your next step? Start with revenue. Calculate your covers × average spend × days × occupancy for month one. Then build from there. A simple, realistic projection beats an elaborate fantasy every time.
For the complete business plan framework, return to our restaurant business plan guide. For UK-specific regulatory requirements, see our restaurant business plan UK guide.
For UK restaurant owners
Turn Your Numbers Into Reality
LocalBrandHub supports UK restaurant owners with marketing strategies that complement solid business fundamentals.
Start Your Free TrialAbout the Author
Local Brand Hub
Empowering UK Businesses
Local Brand Hub provides comprehensive business management tools designed specifically for UK local businesses to streamline operations, automate marketing, and grow revenue.
More articlesRelated Articles
 Business Growth
Restaurant Business Plan: The Complete UK Guide for 2025
Build a restaurant business plan using the 30/30/30/10 cost rule, realistic financial projections, and executive summary templates for UK lenders.
 Business Growth
Restaurant Business Plan UK: What British Lenders Want
Create a restaurant business plan UK lenders will approve. VAT registration, premises licensing, and business rates requirements British banks expect.
 Business Growth
Restaurant Executive Summary: The Page That Gets Read
Write a restaurant executive summary for UK bank managers. What to include, common mistakes, real funding-winning examples.